
Data Science Plotting Data
Create an original labelled chart that makes the observation and unit clear.
How it works
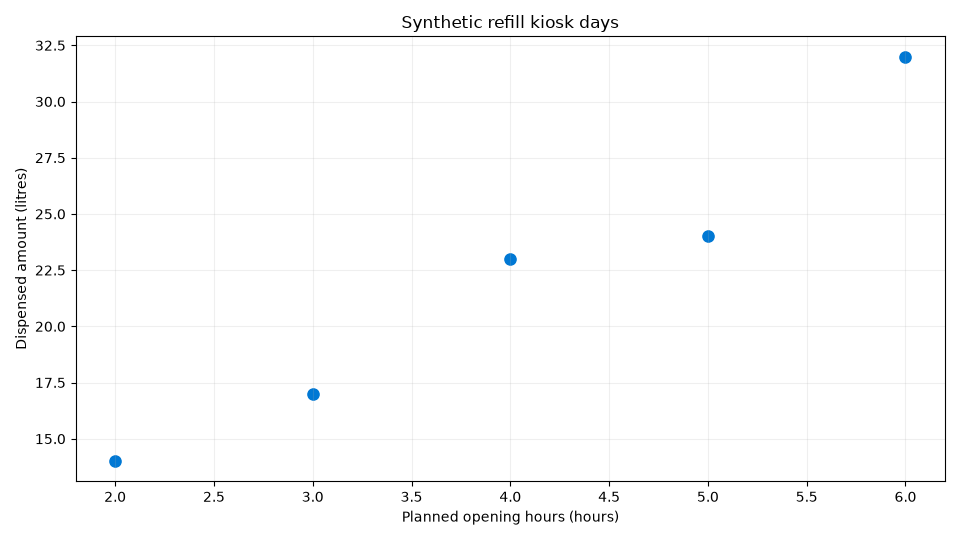
A chart should reveal a relationship without concealing scale, coverage or uncertainty. Use a scatter plot for paired numerical observations and label both axes with their units. The synthetic kiosk example compares planned opening hours with litres dispensed. It illustrates chart construction, not evidence that extending hours causes more demand. Save plots in a separate learning directory so output files do not mix with raw inputs.
Run the code
This is a local example: install Matplotlib 3.11.2 too and run in a separate learning folder; it refuses an existing image file.
Local review: Python 3.12.14, NumPy 2.5.4, Pandas 3.0.6 and SciPy 1.18.0. Browser review: Pyodide 0.27.7, Python 3.12.7, NumPy 2.0.2, Pandas 2.2.3 and SciPy 1.14.1 in their respective editors. Save the download as plotting.py and run python plotting.py in your separate environment. Apache and MySQL are not needed. Environment setup.
Example
import numpy as np
import matplotlib
matplotlib.use("Agg")
import matplotlib.pyplot as plt
from pathlib import Path
hours = np.array([2., 3., 4., 5., 6.])
litres = np.array([14., 17., 23., 24., 32.])
target = Path("kiosk-scatter.png")
if target.exists():
    raise FileExistsError(target)
fig, ax = plt.subplots(figsize=(9.6, 5.4), dpi=100)
ax.scatter(hours, litres, color="#0078d4", s=65)
ax.set(xlabel="Planned opening hours (hours)", ylabel="Dispensed amount (litres)", title="Synthetic refill kiosk days")
ax.grid(alpha=0.2)
fig.tight_layout()
fig.savefig(target)
plt.close(fig)
print("Saved kiosk-scatter.png (960 x 540)")
Expected result
Saved kiosk-scatter.png (960 x 540)
The five points are embedded in the complete source, so no external dataset is required. The plotting backend works without opening a desktop window. The explicit size creates a reproducible 960 by 540 image, and the file check refuses overwriting a learner’s output. Inspect the points rather than adding an unsupported causal trend claim.
Technical references: NumPy, Pandas and SciPy. For evaluation design see the scikit-learn guide to leakage; these examples do not require scikit-learn.