
NumPy Matplotlib
A plot should explain its axes, units and source data. NumPy supplies the values, while Matplotlib creates the figure and rendering.
How it works
This local-only example uses the non-interactive Agg backend, so it saves a PNG without opening a desktop window. Run it in an empty exercises folder with NumPy 2.5.4 and Matplotlib 3.11.2 installed. The file is deliberately not overwritten if it already exists. The browser NumPy runner is text-only and does not claim to provide this plotting environment or a file on your computer.
Run the code
This plotting example runs locally with Python, NumPy 2.5.4 and Matplotlib 3.11.2. It uses a non-interactive backend and saves an original PNG in an empty exercises folder. The text-only browser runner does not provide this plotting environment.
For local work, use a separate virtual environment and run python matplotlib.py. Download the complete source. The reviewed local environment uses Python 3.12.14 and NumPy 2.5.4; the browser uses Pyodide 0.27.7 with NumPy 2.0.2. Compatible examples are checked in both. See the environment setup. No Apache or database server is required.
Example
import numpy as np

from pathlib import Path
import matplotlib
matplotlib.use("Agg")
import matplotlib.pyplot as plt
days = np.arange(1, 4)
litres = np.array([12, 18, 24])
target = Path("tank-readings.png")
if target.exists():
    raise FileExistsError("Choose an empty exercises folder")
fig, ax = plt.subplots(figsize=(8, 4.5), dpi=120)
ax.plot(days, litres, marker="o", color="#0078d4")
ax.set(xlabel="Observation day", ylabel="Collected water (litres)", title="Roof A: fictional collection readings", xticks=days)
fig.tight_layout()
fig.savefig(target)
plt.close(fig)
print("Saved tank-readings.png")
Expected result
Saved tank-readings.png
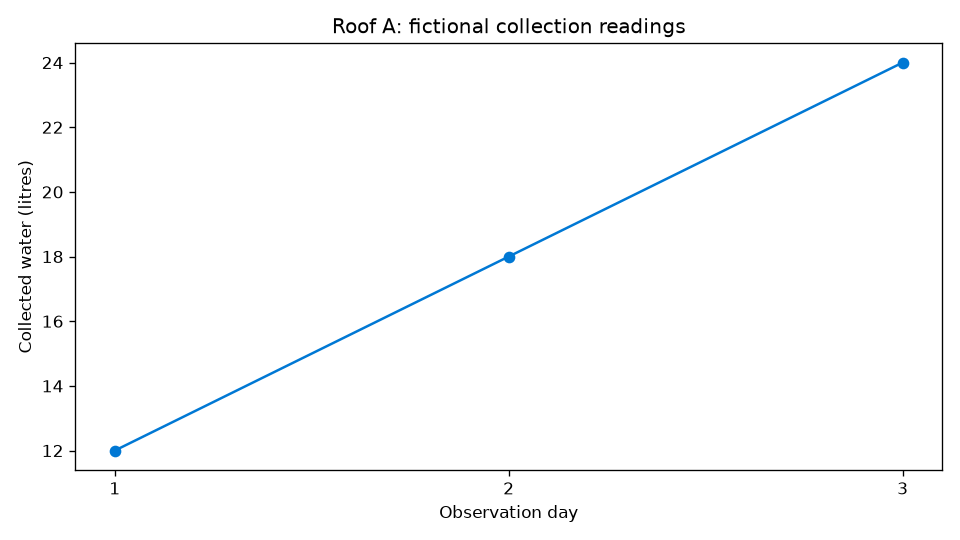
The figure uses the original three-day fixture and labels litres explicitly. The connected points visualize an ordered sequence, not proof of a continuous physical process between observations. Inspect the saved image as well as the successful file write.
Use NumPy’s official reference for precise contracts, supported versions and numerical limitations.